

Authored by: Elliott Mason
For a long time, the wonderful world of quantum mechanics has baffled and astounded scientists attempting to understand the universe. This has included understanding its intrinsic phenomena that occur at the smallest possible scale and, as the recent Nobel Prize in Physics to a trio of entanglement pioneers has reminded us, testing its spooky predictions. As we progress through the 21st century, attention has shifted from understanding the theory and the applications of Quantum 1.0 such as transistors and lasers (transformative in their own right) to the emergence of multiple technologies that exploit the weirdness of Quantum 2.0, including quantum computing and quantum communications.
While quantum computing is inspiring companies large and small in a race to realize enough of the over classical computing to attract commercial interest, quantum communications is also gaining interest from a variety of entities with diverse motivations. These motivations include goals such as targeted deployment of quantum cryptography (quantum key distribution and other techniques) to securely transmit data between users (even in the face of the threat from quantum computers) and networking all kinds of quantum sensors and computing devices, from interconnects used to scale up the early quantum processors to the ubiquitous distribution of entanglement as a resource and what some are calling the “Quantum Internet.”
Quantum computing and communications are active research areas, and although many uses are still in the future, the rush to protect intellectual property is happening now. Analyzing the number of patents and patent applications from businesses and research institutions around the world can be a helpful tool to track innovation.
In our blog posts published last year, we detailed patent trends related to quantum computing and quantum communications. These pieces showed data based on published patent documents over a ten-year period up to the end of 2020. By analyzing the total number of patents, Patent Cooperation Treaty (PCT) applications, the top ten patent applicants and the national offices where patents are most commonly filed, we can get a picture of where innovation is occurring, the entities investing in R&D and where they see markets soon developing.
This blog post is as an update to those posts, adding new data taking us through the end of 2022.
The information presented is based on publicly available data from the Derwent Innovation platform. Custom queries were developed to identify a set of patents and applications related to quantum computing and another set of patents and applications related to quantum communications. The resulting data compiled based on these queries, which are the same as those used in our previous blog, includes information on:
When considering the data, it is essential to note the published patent applications included are those that have been examined and issued as patents. There is typically a fixed delay (of 18 months) between a patent application’s effective filing date and its publication date (unless the patent was issued sooner than 18 months, or had a nonpublication request), but a widely varying delay between its effective filing date and its issuance. These data for issued patents are plotted by publication year, and therefore more closely track filing trends rather than issuance trends. It should be noted that the numbers for recent years are also subject to increase in the future as patents are issued from currently pending applications. The PCT data show the number of applications filed (also by publication year), however, these numbers won’t change because PCT applications are not officially examined and therefore are never issued.
Figure 1a.
Figure 1a shows the upward trend of quantum computing patent applications continuing through 2021 and 2022. However, 2022’s data suggests this growth may be slowing slightly. The top 19 entities filing quantum computing patents are shown along with their totals (over the entire 13-year period). All other entities, representing around six and a half times that of the top patent filer (IBM), are grouped under “Other”.
Notable trends in 2021 and 2022:
It should be noted that there are alternative ways of plotting patents over time. For example, instead of plotting by publication year, it is possible to plot by “application year” corresponding to the year in which the application that issued as a patent was filed, which is shown in Figure 1b.
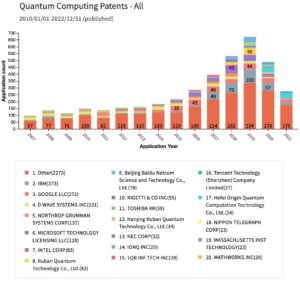
Figure 1b.
One difference between Figures 1a and 1b is that in Figure 1b the years span from 2007 to 2021 since many of the applications published in 2010 were filed in 2007. Also, the patents in this data set that were issued by 2022 were filed in 2021 or earlier. This data set also more explicitly shows the effect of the 18-month publication delay since applications filed in 2021 and the latter half of 2020 were not published by the end of 2022, and thus do not show up in this data set.
It is also possible to plot data not only for issued patents but also all applications filed, which is shown in Figure 1c. This data set includes applications that may have been abandoned, or that are pending but not yet issued (and may never issue) as patents. The numbers are, of course, larger and the increase of recent years is even more evident.
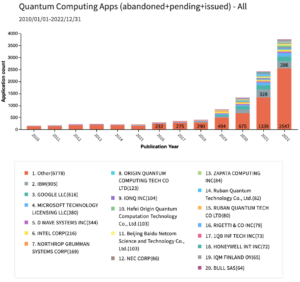
Figure 1c.
Figure 2.
Figure 2 isolates the data from the top ten patent filers shown in Figure 1a. While growth remains in the total number of granted quantum computing patents, among the top ten entities, the number of patents/year may be leveling off. This data set even shows a slight decrease in 2022 vs. 2021. This potential leveling off suggests that quantum computing innovation is less concentrated and now occurring across a larger number of entities. The reason for a potential leveling off in patenting by the top filers is the 2022 numbers will likely increase in the future as more of the pending published applications are issued in the coming months and years.
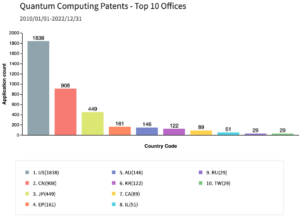
Figure 3.
Figure 3 shows the US patent office remains the leader in quantum computing patents filed, with the number filed in China in 2nd place since 2010. But, the data from the previous post for quantum computing showed a larger lead for the US patent office (285%). For the most part, patent offices in different countries work in similar ways, though the patent laws and examination procedures are different, so there may be effects on the numbers due to those differences. A significant motivation for filing in a given country is to obtain patent protection where the manufacture, use, and sale are expected to occur.
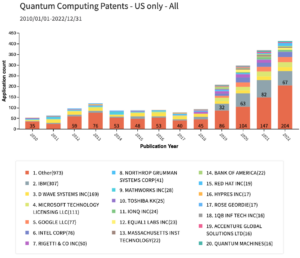
Figure 4.
While the US remains the top patent office for quantum computing over the thirteen-year period we are analyzing, recent data (Figure 4) shows a possible slowdown in the growth of the number of patents. Chinese companies are not among the top filers in the USPTO.
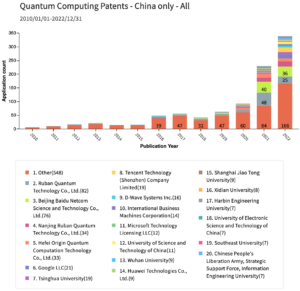
Figure 5.
In comparison, the Chinese patent office has seen rapid growth in quantum computing patents over recent years, as shown in Figure 5. The first modest jump occurred around 2016, with more significant increases in each of the past couple of years. Most of the top filers are Chinese companies, but some US companies are also filing for protection in China.
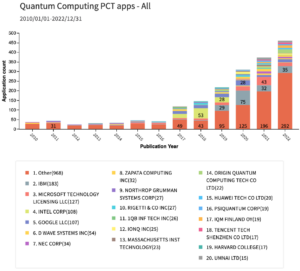
Figure 6.
Figure 6 shows trends in PCT applications, indicating an intent to file for the patent across multiple countries. Again, this data set shows the total number of patent applications through the end of 2022. While smaller in number, the PCT data show a similar trend to the total number of issued patents, with some differences in the entities listed in the top 19.
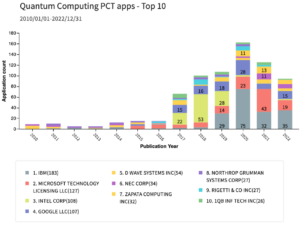
Figure 7.
Data from the most common PCT patent filers (Figure 7) demonstrate a downward trend from the peak in 2020. This suggests that top quantum computing entities may be filing less internationally, or may be filing their patents directly in multiple countries’ patent offices without first going through the PCT. This can occur if an entity is taking a more targeted filing strategy.
Figure 8.
My previous blog post on quantum communications patent trends showed an upward trend beginning in 2019. Recent data from 2021 and 2022 (Figure 8) confirm this trend, without the sign of the potential slowing of growth that was present in the quantum computing data.
Figure 9.
However, this upward trend is not as consistent when looking at only the top ten entities (Figure 9), with a slight drop in 2021 and a modest growth in 2022 compared to the overall numbers when the “Other” category is included.
Figure 10.
Unlike quantum computing, China is leading the way in issuing quantum communications patents, followed by the US in 2nd (Figure 10). Also, the data from the previous post for quantum communications showed the Chinese patent office with only a relatively small lead over the US patent office, so their lead seems to be growing with the past 2 years of data included.
Figure 11.
Data from the patent office in China (Figure 11) shows a clear upward trend starting around 2016 and strong growth continuing.
Figure 12.
In contrast, Figure 12 shows that the total number of quantum communications patents issued in the US have fluctuated since 2010. This suggests that the overall growth shown in Figure 8 results from patents filed outside the US. However, 2022 shows a significant jump in the number of issued quantum communications patents in the US, around twice the 2021 number.
Figure 13.
Quantum communications PCT applications (Figure 13) replicate the growth shown in the total number of issued patents. While the numbers are smaller, the steady upward trend in recent years remains.
Figure 14.
Figure 14 shows the same data as Figure 13, except only for the top ten PCT application filers. This group represents a greater variety of countries than in previous plots for top quantum communications filers, with entities headquartered in China, Malaysia, the UK, Japan, Finland, Sweden, and the US. However, the numbers associated with each entity are relatively small and compared to the data for quantum computing PCT applications (Figures 6 and 7) the top PCT application filers make up a smaller fraction of the total, suggesting quantum communications PCT applications are more spread out among entities innovating in the field.
The updated plots with data from 2021 and 2022 show the continued growth in both quantum computing and quantum communications patents worldwide, but especially in China. Data from the patent office in China indicates an increase in both quantum communications patents, where it already led the US office, and quantum computing patents, where it is closing the gap on the US office.
In each of my previous posts, I picked a “solution of the day” describing an interesting problem being solved, as revealed in a recently published (PCT) patent application from the data, for the respective area of quantum computing or quantum communications being addressed in that post. In this post, I will pick an additional solution in each area. Since this blog series has generally avoided revealing specific legal claims being pursued by any particular entity, the solutions are described in terms of the general problems being addressed.
One recently published quantum computing patent application provides solutions to problems related to quantum data loaders. Quantum circuits can be used to load classical data into quantum states that can then be used for quantum algorithms such as quantum machine learning. Some loaders, also called Quantum Random Access Memory (QRAM) are large and complex in terms of the number of input qubits and the circuit depth. Techniques can be used to reduce the size and complexity.
One recently published quantum communications patent application provides solutions to problems related to determination of a detection pattern of signals in an optical quantum system, such as a quantum repeater network. Particular subsets of detectors in the system can be checked in the process of performing measurements (e.g., Bell state measurements). Techniques can be used to provide high-frequency pattern detection in a scalable way.
While I have kept the specific patent application anonymous in this post, interested readers can contact me for discussion on this or any other topic that is publicly disclosed and not client-confidential (mason@youngbasile.com).
Elliott Mason is a patent agent at the law firm Young Basile, has a PhD in nonlinear and quantum optics, and was an experimentalist on a team at MIT working to demonstrate enabling technologies for long-distance quantum teleportation. The views expressed in this blog entry are those of the author, and do not constitute a legal opinion and do not necessarily reflect the official policy or position of the QED-C, SRI International, or Young Basile. Any content provided is not intended to malign any country, ethnic group, company, organization, or individual.